01
What happened?
Read what is present.
Time series, ranges, basic statistics and visible changes establish what the dataset literally shows.
What does the dataset literally show?
Study / experiment
Some questions are easier to understand when you build something and test them.
This is where I experiment with environmental measurements, analysis and interpretation — including the limitations.
Study 01
Same data. Better questions.
How much more understanding can better questions extract from the same environmental dataset?
Prominent limitations
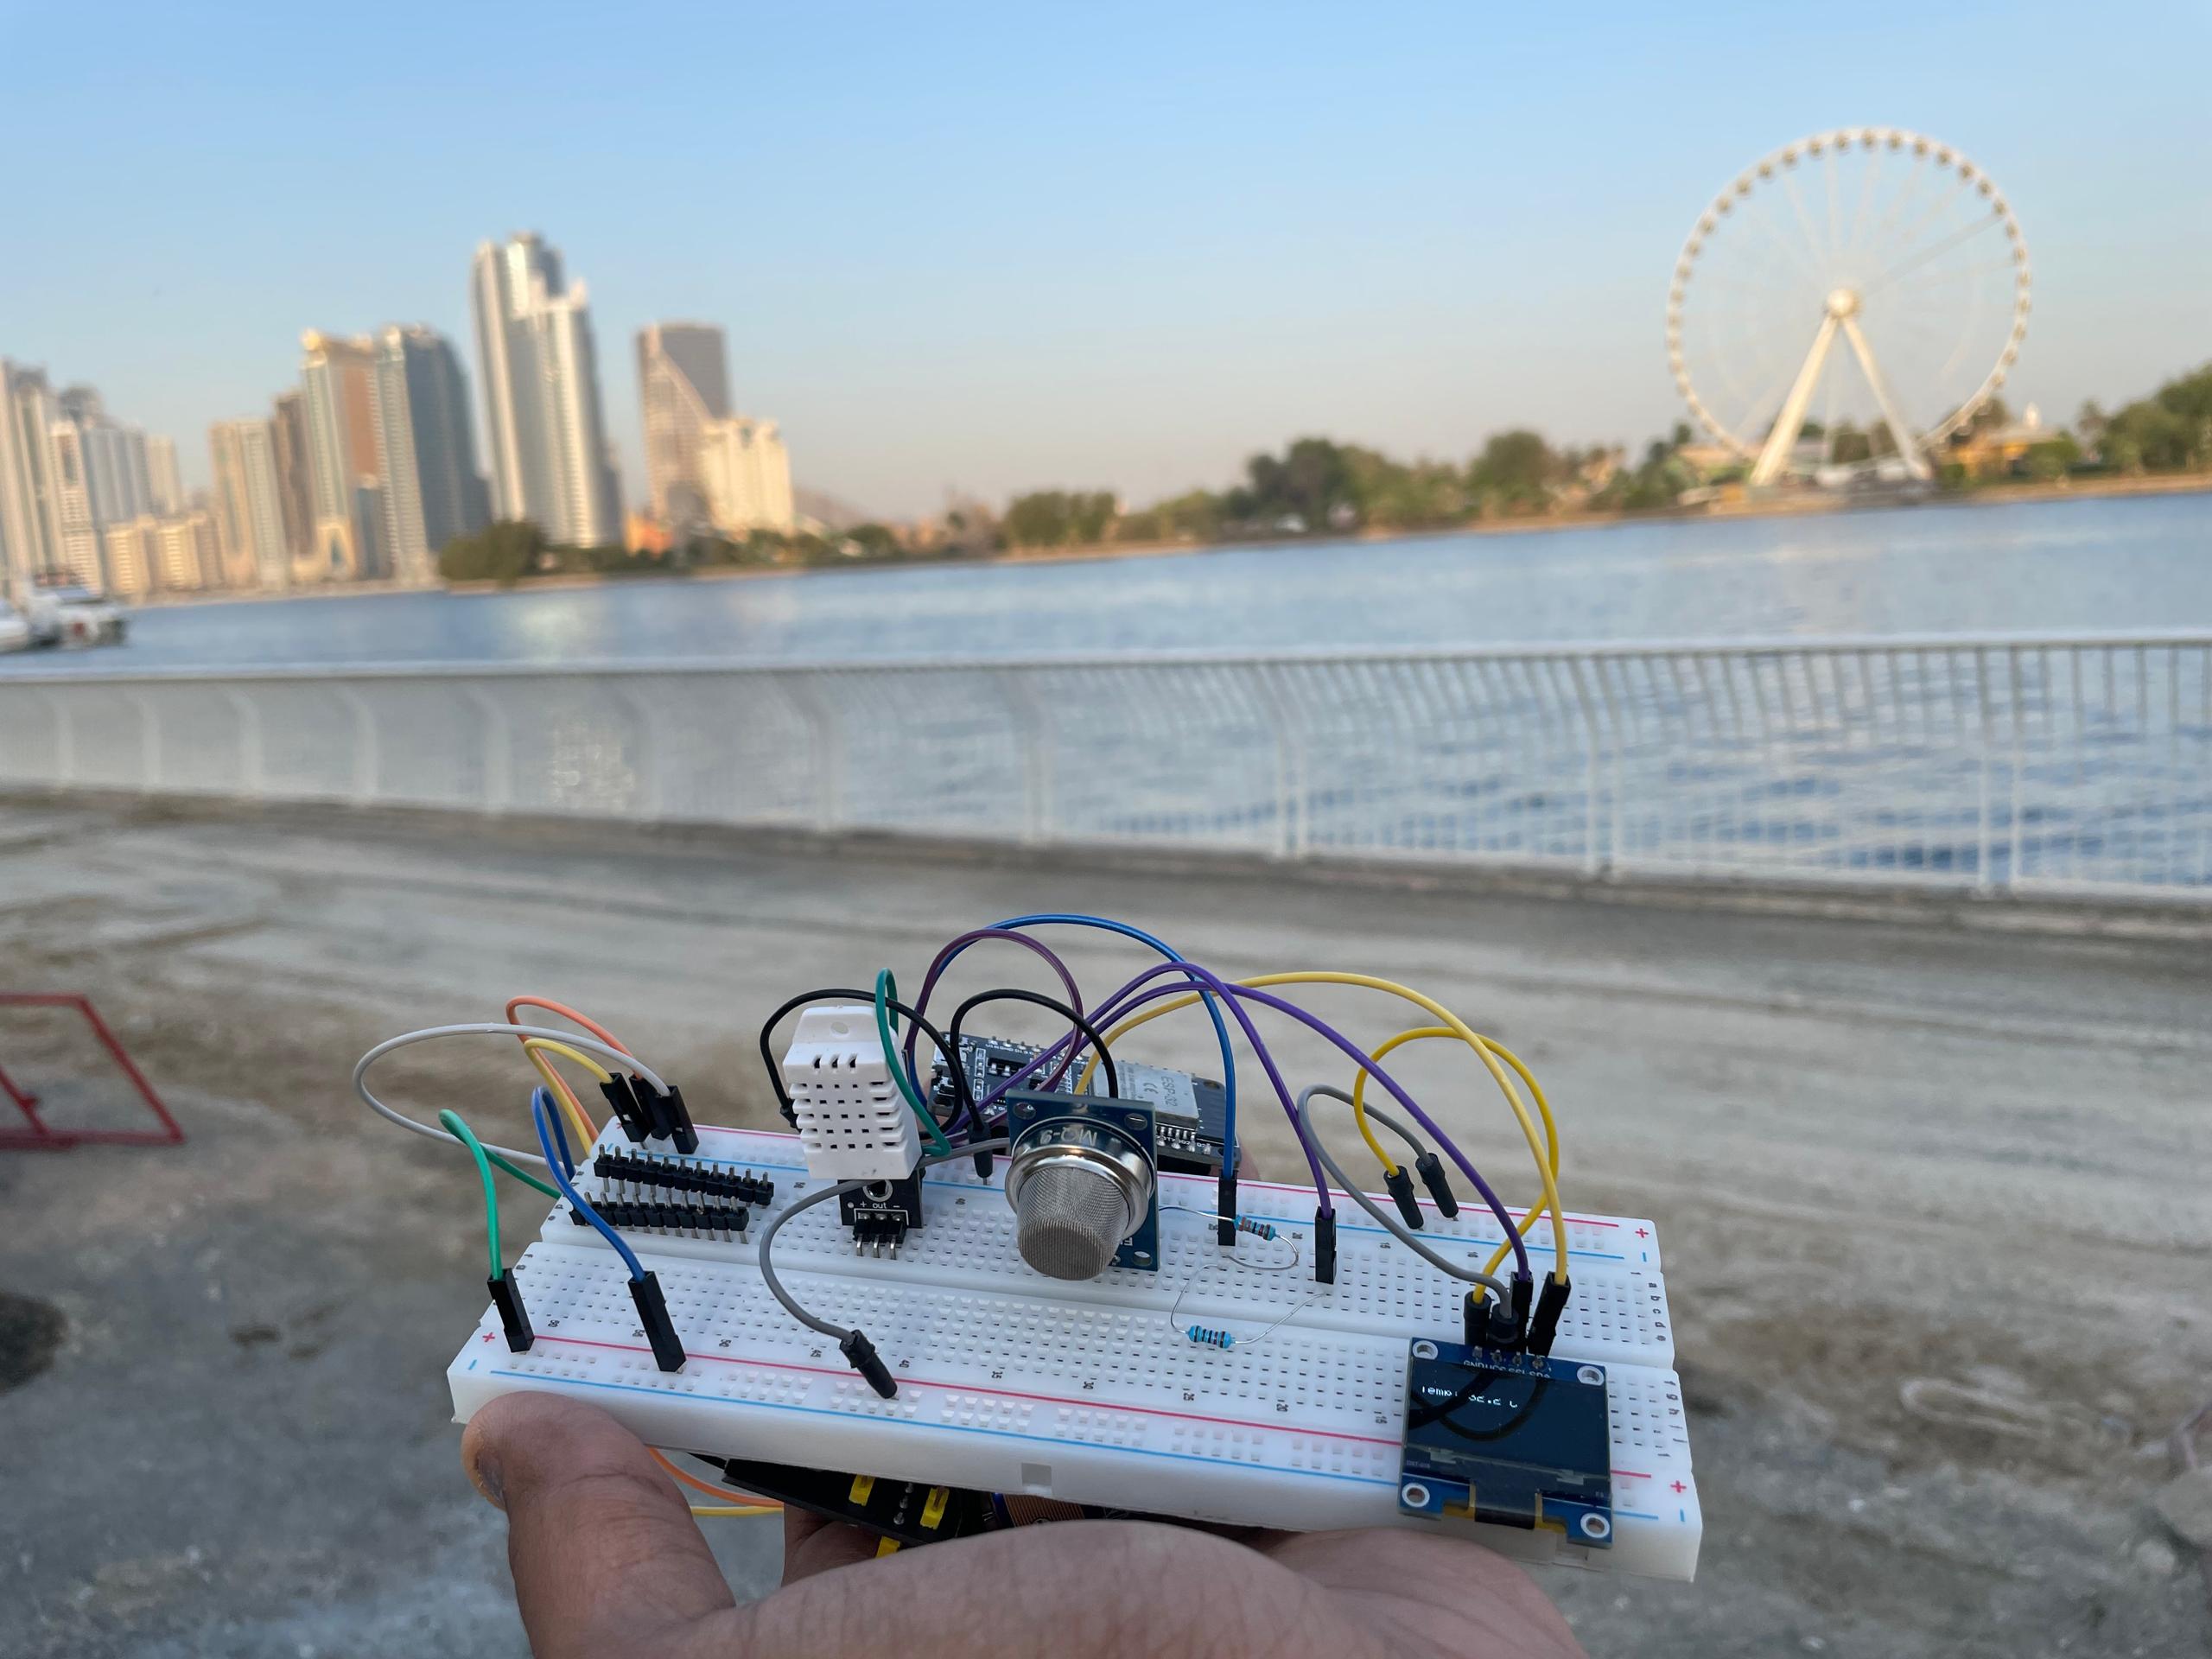
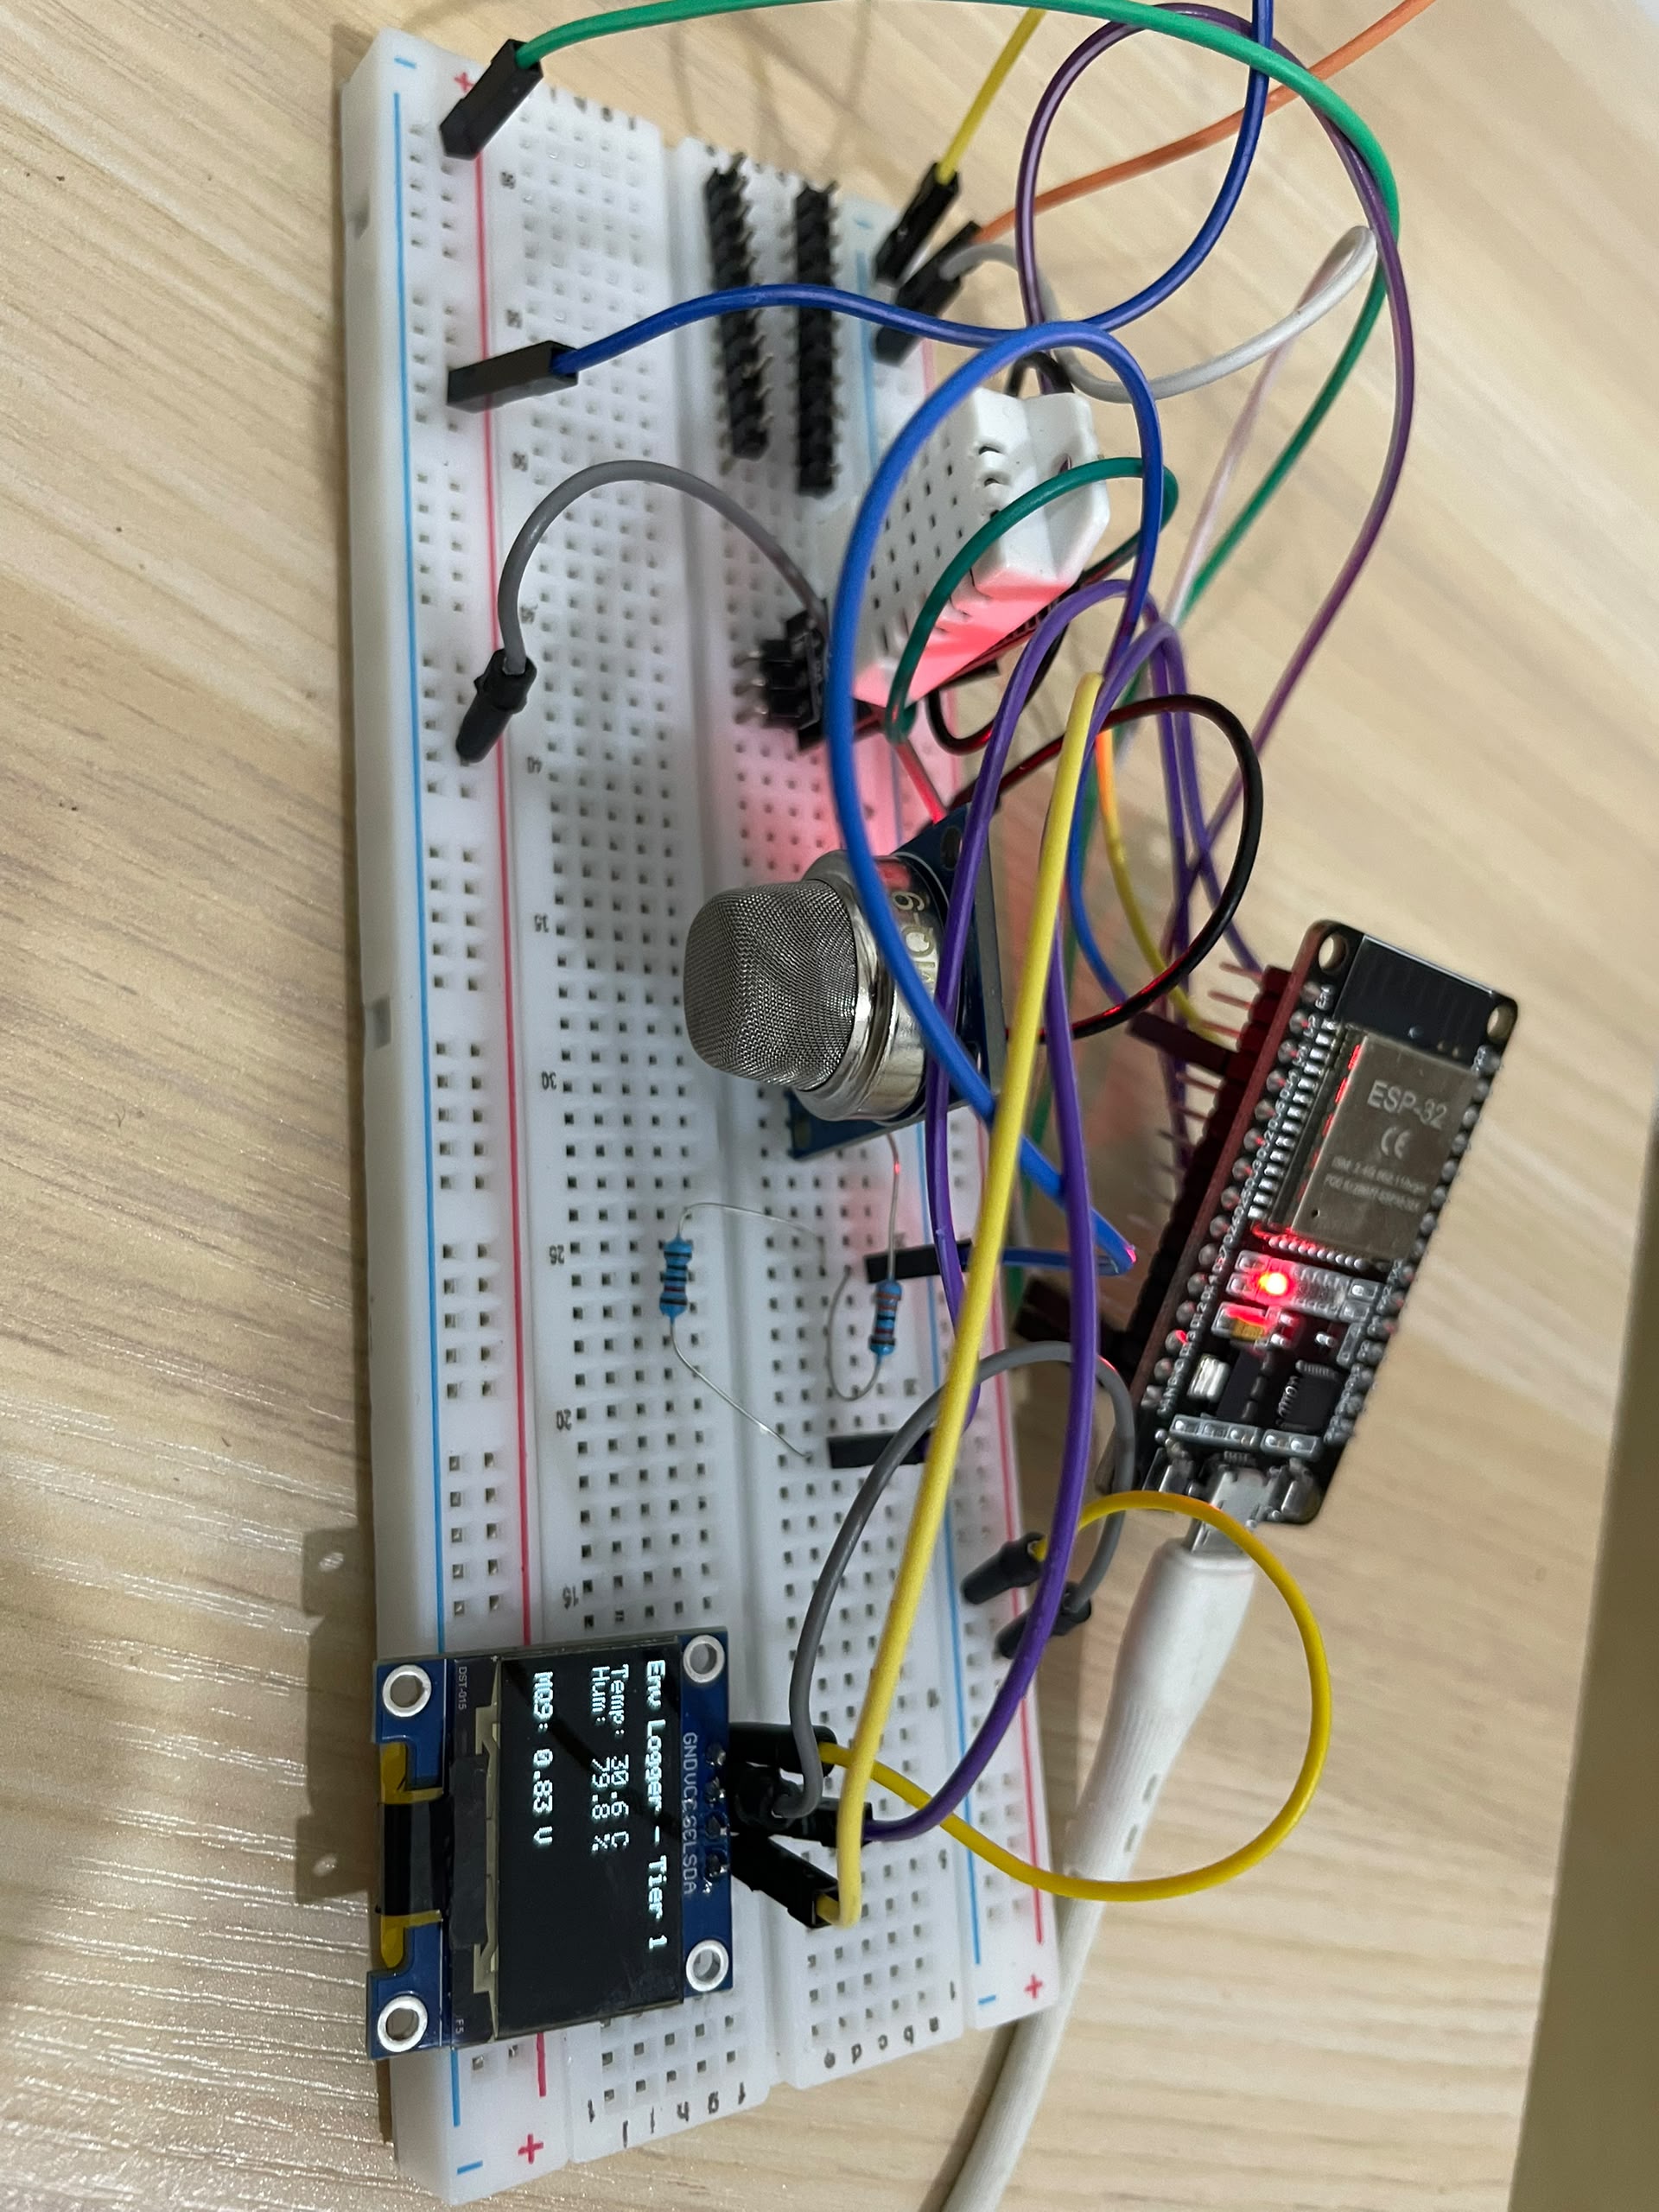
The setup
Hardware is intentionally simple. The main story is the progression of analysis and interpretation, not the electronics.
Experiment media
Five stages
What happened?
Time series, ranges, basic statistics and visible changes establish what the dataset literally shows.
What does the dataset literally show?
What moves together?
Correlation can expose variables that change together and suggest where the next question belongs.
Correlation is a clue, not a cause.
What changes the interpretation?
Environmental conditions, sensor placement, operating context and missing information can change what a pattern means.
What information is missing from the number itself?
Can I trust the interpretation?
Sensor limitations, calibration, uncertainty, data quality and reconstruction limitations constrain the analysis.
Better analysis does not repair weak evidence.
What could I responsibly decide?
The useful endpoint is not the most sophisticated explanation. It is the interpretation or decision the available evidence can actually support.
What does the available evidence actually support?
The sensor did not become more sophisticated. The questions did.
Same data. Better questions.